Tools Programming Guide
Contents
Tools Programming Guide
Initialization
Environment Variables
The following environment variables are required to be enabled during zeInit for the respective feature.
Category |
Name |
Values |
Description |
|---|---|---|---|
Tools |
ZET_ENABLE_API_TRACING_EXP |
{0, 1} |
Enables driver instrumentation for API tracing Note: This tracing environment variable is deprecated. Please use the tracing loader layer instead. |
ZET_ENABLE_METRICS |
{0, 1} |
Enables driver instrumentation and dependencies for device metrics |
|
ZET_ENABLE_PROGRAM_INSTRUMENTATION |
{0, 1} |
Enables driver instrumentation and dependencies for program instrumentation |
|
ZET_ENABLE_PROGRAM_DEBUGGING |
{0, 1} |
Enables driver instrumentation and dependencies for program debugging |
API Tracing
Experimental Extension - this feature will be removed post-1.0 and replaced with custom loader layers.
Introduction
API tracing provides a way for tools to receive notifications of API calls made by an application. The callbacks provide direct access to the input and output parameters for viewing and modification. Tools may also use these notifications as triggers to block and inject new API calls into the command stream, such as metrics.
Registration
Tools may independently register for enter and exit callbacks for individual API calls, per driver instance.
zetTracerExpSetPrologues is used to specify all the enter callbacks
zetTracerExpSetEpilogues is used to specify all the exit callbacks
If the value of a callback is nullptr, then it will be ignored.
The callbacks are defined as a collection of per-API function pointers, with the following parameters:
params : a structure capturing pointers to the input and output parameters of the current instance
result : the current value of the return value
pTracerUserData : the user’s pointer for the tracer’s data
ppTracerInstanceUserData : a per-tracer, per-instance thread-local storage location; typically used for passing data from the prologue to the epilogue
Note: since the creation of a tracer requires a device, on first glance it appears that zeInit, zeDriverGet and zeDeviceGet are not traceable. However, these APIs are traceable for all calls subsequent from the creation and enabling of the tracer itself.
Enabling/Disabling and Destruction
The tracer is created in a disabled state and must be explicitly enabled by calling zetTracerExpSetEnabled. The implementation guarantees that prologues and epilogues will always be executed in pairs; i.e.
if the prologue was called then the epilogue is guaranteed to be called, even if another thread disabled the tracer between execution
if the prologue was not called then the epilogue is guaranteed not to be called, even if another thread enabled the tracer between execution
The tracer should be disabled by the application before the tracer is destroyed. If multiple threads are in-flight, then it is still possible that callbacks will continue to execute even after the tracer is disabled; specifically, due to the pairing rules above. Due to the complexity involved in ensuring no threads are still or will be executing a callback even after its been disabled, the implementation will stall and wait for any outstanding threads during zetTracerExpDestroy.
The following pseudo-code demonstrates a basic usage of API tracing:
typedef struct _my_tracer_data_t
{
    uint32_t instance;
} my_tracer_data_t;

typedef struct _my_instance_data_t
{
    clock_t start;
} my_instance_data_t;

void OnEnterCommandListAppendLaunchKernel(
    ze_command_list_append_launch_kernel_params_t* params,
    ze_result_t result,
    void* pTracerUserData,
    void** ppTracerInstanceUserData )
{
    my_instance_data_t* instance_data = malloc( sizeof(my_instance_data_t) );
    *ppTracerInstanceUserData = instance_data;

    instance_data->start = clock();
}

void OnExitCommandListAppendLaunchKernel(
    ze_command_list_append_launch_kernel_params_t* params,
    ze_result_t result,
    void* pTracerUserData,
    void** ppTracerInstanceUserData )
{
    clock_t end = clock();

    my_tracer_data_t* tracer_data = (my_tracer_data_t*)pTracerUserData;
    my_instance_data_t* instance_data = (my_instance_data_t*)ppTracerInstanceUserData;

    float time = 1000.f * ( end - instance_data->start ) / CLOCKS_PER_SEC;
    printf("zeCommandListAppendLaunchKernel #%d takes %.4f msn", tracer_data->instance++, time);

    free(instance_data);
}

void TracingExample( ... )
{
    my_tracer_data_t tracer_data = {};
    zet_tracer_exp_desc_t tracer_desc {};
    tracer_desc.stype = ZET_STRUCTURE_TYPE_TRACER_EXP_DESC;
    tracer_desc.pUserData = &tracer_data;
    zet_tracer_exp_handle_t hTracer;
    zetTracerExpCreate(hDevice, &tracer_desc, &hTracer);

    // Set all callbacks
    zet_core_callbacks_t prologCbs = {};
    zet_core_callbacks_t epilogCbs = {};
    prologCbs.CommandList.pfnAppendLaunchFunction = OnEnterCommandListAppendLaunchKernel;
    epilogCbs.CommandList.pfnAppendLaunchFunction = OnExitCommandListAppendLaunchKernel;

    zetTracerExpSetPrologues(hTracer, &prologCbs);
    zetTracerExpSetEpilogues(hTracer, &epilogCbs);

    zetTracerExpSetEnabled(hTracer, true);

    zeCommandListAppendLaunchKernel(hCommandList, hFunction, &launchArgs, nullptr, 0, nullptr);
    zeCommandListAppendLaunchKernel(hCommandList, hFunction, &launchArgs, nullptr, 0, nullptr);
    zeCommandListAppendLaunchKernel(hCommandList, hFunction, &launchArgs, nullptr, 0, nullptr);

    zetTracerExpSetEnabled(hTracer, false);
    zetTracerExpDestroy(hTracer);
}
Metrics
Introduction
Devices provide programmable infrastructure designed to support performance debugging. The API described in this document provides access to these device metrics. The intention of this API is to support performance debug and it is not advised to use it in regular execution as overall performance can be negatively impacted.
Most of the detailed metrics require the device to be properly programmed before use. It is important to understand that the device programming is in most cases global. This generally means that if a software tool or an application is using the metrics then no other application can reliably use the same device resources.
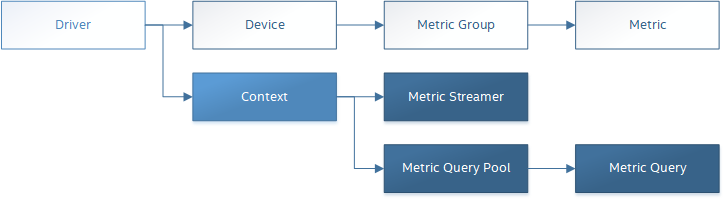
Metric Groups
The device infrastructure consists of a pre-defined set of non-programmable counters, and a programmable network of connections that work with a separate set of counters as well as other types of counters. For sake of simplicity, the smallest unit of configuration is a Metric Group. Metric Groups are sets of metrics that provide certain perspective on workload’s performance. The groups aggregate metrics, define device programming and available collection methods. An application may choose to collect data from several Metric Groups provided that they all belong to different domains. Domains are used as a software representation of independent device resources that can safely be used concurrently.
Sampling Types
Sampling types are a software representation of device capabilities in terms of reading metric values. Each Metric Group provides information on which sampling types it supports. There are separate sets of APIs supporting each of the sampling types Time-based and Event-based.
All available sampling types are defined in zet_metric_group_sampling_type_flags_t.
Information about supported sampling types for a given Metric Group is provided in zet_metric_group_properties_t.samplingType.
It’s possible that a device provides multiple Metric Groups with the same names but different sampling types.
When enumerating, it’s important to choose a Metric Group which supports the desired sampling type.
Domains
Every Metric Group belongs to a given domain (zet_metric_group_properties_t.domain).
The Metric Group typically define a uniform device counter configuration used for measurements.
Each domain represents an exclusive resource used by the Metric Group.
It’s possible to simultaneously gather data for two different Metric Groups, only if they belong to a different domain i.e. Metric Groups that can be collected concurrently will have different domain values.
Enumeration
All available metrics are organized into Metric Groups.
During data collection, data for the whole Metric Group is gathered.
The list of available Metric Groups and their Metrics is device-specific.
The following APIs provide all the information needed for identification and usage.
Metric Group properties are accessed through the function zetMetricGroupGetProperties which returns zet_metric_group_properties_t.
Metric properties are accessed through the function zetMetricGetProperties which returns zet_metric_properties_t.
A common tool flow is to enumerate metrics looking for a specific Metric Group. Depending on the metrics required for a specific scenario a tool may choose to run the workload multiple times, recording different set of Metric Groups each time. Usually care must be taken to ensure run-to-run stability and result repeatability if metrics from different runs are meant to be used together. When enumerating metrics to find a desired Metric Group, it’s important to know in advance which sampling type will be used.
To enumerate through the Metric tree:
Call zetMetricGroupGet to obtain Metric Group count.
Call zetMetricGroupGet to obtain all Metric Groups.
Iterate over all available Metric Groups.
At this point it’s possible to check Metric Group name, domain or sampling type.
Metric Group names may not be unique.
Obtain the metric count for each Metric Group by calling zetMetricGroupGetProperties with Metric Group handle (zet_metric_group_handle_t) and checking zet_metric_group_properties_t.metricCount.
Iterate over available Metrics using zetMetricGet with parent Metric Group (zet_metric_group_handle_t).
Check Metric properties (e.g. name, description) calling zetMetricGetProperties with parent Metric (zet_metric_handle_t).
The following pseudo-code demonstrates a basic enumeration over all available metric groups and their metrics. Additionally, it returns a metric group with a chosen name and sampling type. Similar code could be used for selecting a preferred metric group for a specific type of measurements.
ze_result_t FindMetricGroup( ze_device_handle_t hDevice,
                               char* pMetricGroupName,
                               uint32_t desiredSamplingType,
                               zet_metric_group_handle_t* phMetricGroup )
{
    // Obtain available metric groups for the specific device
    uint32_t metricGroupCount = 0;
    zetMetricGroupGet( hDevice, &metricGroupCount, nullptr );

    zet_metric_group_handle_t* phMetricGroups = malloc(metricGroupCount * sizeof(zet_metric_group_handle_t));
    zetMetricGroupGet( hDevice, &metricGroupCount, phMetricGroups );

    // Iterate over all metric groups available
    for( i = 0; i < metricGroupCount; i++ )
    {
        // Get metric group under index 'i' and its properties
        zet_metric_group_properties_t metricGroupProperties {};
        metricGroupProperties.stype = ZET_STRUCTURE_TYPE_METRIC_GROUP_PROPERTIES;
        zetMetricGroupGetProperties( phMetricGroups[i], &metricGroupProperties );

        printf("Metric Group: %sn", metricGroupProperties.name);

        // Check whether the obtained metric group supports the desired sampling type
        if((metricGroupProperties.samplingType & desiredSamplingType) == desiredSamplingType)
        {
            // Check whether the obtained metric group has the desired name
            if( strcmp( pMetricGroupName, metricGroupProperties.name ) == 0 )
            {
                *phMetricGroup = phMetricGroups[i];
                break;
            }
        }
    }

    free(phMetricGroups);
}
Configuration
Use the zetContextActivateMetricGroups API call to configure the device for data collection.
Subsequent calls to the function will disable device programming for the metric groups not selected for activation.
To avoid undefined results only call the zetContextActivateMetricGroups between experiments i.e. while not collecting data.
Programming restrictions:
Any combination of metric groups can be configured simultaneously provided that all of them have a different zet_metric_group_properties_t.domain.
MetricGroup must be active until zetMetricStreamerClose and the last zetCommandListAppendMetricQueryEnd completes.
Collection
There are two modes of metrics collection supported: time-based and event-based.
Time-based collection is using a timer as well as other events to store data samples. A metric streamer interface is the software interface for configuration and collection.
Event-based collection is based on a pair of Begin/End events appended to command lists. A metric query interface is the software interface for configuration and collection.
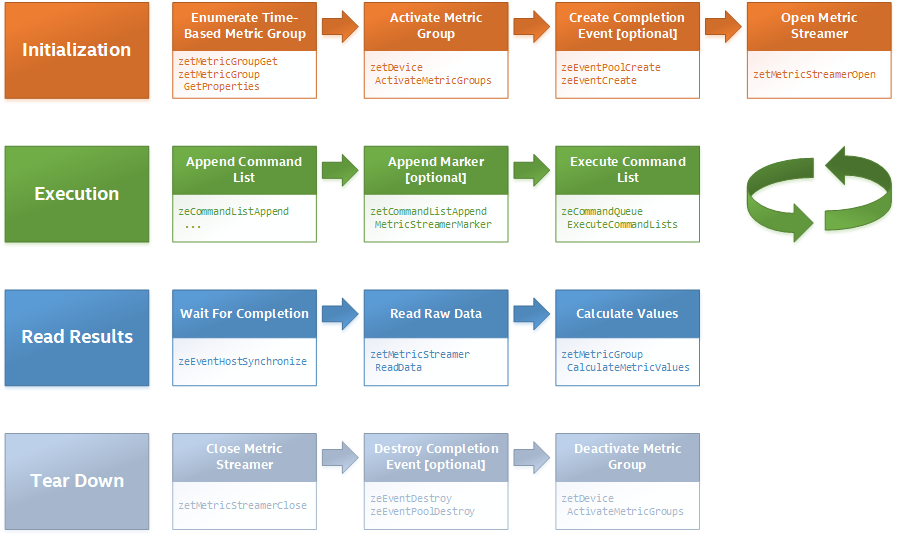
Metric Streamer
Time-based collection uses a simple Open, Read, Close scheme:
zetMetricStreamerOpen opens the streamer.
zetMetricStreamerReadData reads the raw data to be later processed by zetMetricGroupCalculateMetricValues.
zetMetricStreamerClose closes the streamer.
The following pseudo-code demonstrates a basic sequence for time-based collection:
ze_result_t TimeBasedUsageExample( ze_context_handle_t hContext,
                                     ze_device_handle_t hDevice )
{
    zet_metric_group_handle_t     hMetricGroup           = nullptr;
    ze_event_handle_t            hNotificationEvent     = nullptr;
    ze_event_pool_handle_t       hEventPool             = nullptr;
    ze_event_pool_desc_t         eventPoolDesc          = {ZE_STRUCTURE_TYPE_EVENT_POOL_DESC, nullptr, 0, 1};
    ze_event_desc_t              eventDesc              = {ZE_STRUCTURE_TYPE_EVENT_DESC};
    zet_metric_streamer_handle_t  hMetricStreamer        = nullptr;
    zet_metric_streamer_desc_t    metricStreamerDesc     = {ZET_STRUCTURE_TYPE_METRIC_STREAMER_DESC};

    // Find a "ComputeBasic" metric group suitable for Time Based collection
    FindMetricGroup( hDevice, "ComputeBasic", ZET_METRIC_GROUP_SAMPLING_TYPE_FLAG_TIME_BASED, &hMetricGroup );

    // Configure the HW
    zetContextActivateMetricGroups( hContext, hDevice, /* count= */ 1, &hMetricGroup );

    // Create notification event
    zeEventPoolCreate( hContext, &eventPoolDesc, 1, &hDevice, &hEventPool );
    eventDesc.index  = 0;
    eventDesc.signal = ZE_EVENT_SCOPE_FLAG_HOST;
    eventDesc.wait   = ZE_EVENT_SCOPE_FLAG_HOST;
    zeEventCreate( hEventPool, &eventDesc, &hNotificationEvent );

    // Open metric streamer
    metricStreamerDesc.samplingPeriod       = 1000;
    metricStreamerDesc.notifyEveryNReports  = 32768;
    zetMetricStreamerOpen( hContext, hDevice, hMetricGroup, &metricStreamerDesc, hNotificationEvent, &hMetricStreamer );

    // Run your workload, in this example we assume the data for the whole experiment fits in the device buffer
    Workload(hDevice);
    // Optionally insert markers during workload execution
    //zetCommandListAppendMetricStreamerMarker( hCommandList, hMetricStreamer, tool_marker_value );

    // Wait for data, optional in this example since the whole workload has already been executed by now
    //zeEventHostSynchronize( hNotificationEvent, 1000 /*timeout*/ );
    // reset the event if it fired

    // Read raw data
    size_t rawSize = 0;
    zetMetricStreamerReadData( hMetricStreamer, UINT32_MAX, &rawSize, nullptr );
    uint8_t* rawData = malloc(rawSize);
    zetMetricStreamerReadData( hMetricStreamer, UINT32_MAX, &rawSize, rawData );

    // Close metric streamer
    zetMetricStreamerClose( hMetricStreamer );
    zeEventDestroy( hNotificationEvent );
    zeEventPoolDestroy( hEventPool );

    // Deconfigure the device
    zetContextActivateMetricGroups( hContext, hDevice, 0, nullptr );

    // Calculate metric data
    CalculateMetricsExample( hMetricGroup, rawSize, rawData );
    free(rawData);
}
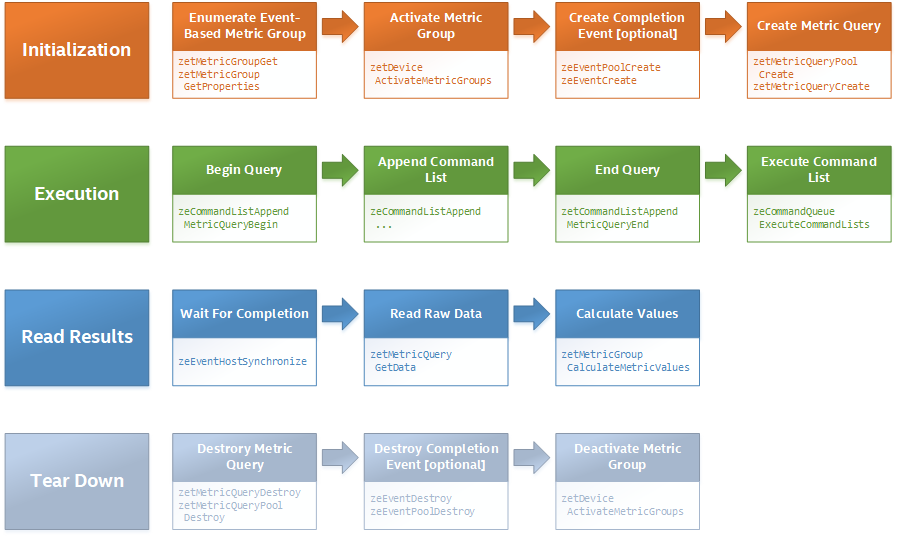
Metric Query
Event-based collection uses a simple Begin, End, GetData scheme:
zetCommandListAppendMetricQueryBegin defines the start counting event
zetCommandListAppendMetricQueryEnd defines the finish counting event
zetMetricQueryGetData reads the raw data to be later processed by zetMetricGroupCalculateMetricValues.
Typically, multiple queries are used and recycled to characterize a workload. A Query Pool is used to efficiently use and reuse device memory for multiple queries.
zetMetricQueryPoolCreate creates a pool of homogeneous queries.
zetMetricQueryPoolDestroy frees the pool. The application must ensure no queries within the pool are in-use before freeing the pool.
zetMetricQueryCreate obtains a handle to a unique location in the pool.
zetMetricQueryReset allows for low-cost recycling of a location in the pool.
The following pseudo-code demonstrates a basic sequence for query-based collection:
ze_result_t MetricQueryUsageExample( ze_context_handle_t hContext,
                                       ze_device_handle_t hDevice )
{
    zet_metric_group_handle_t      hMetricGroup          = nullptr;
    ze_event_handle_t             hCompletionEvent      = nullptr;
    ze_event_pool_desc_t          eventPoolDesc         = {ZE_STRUCTURE_TYPE_EVENT_POOL_DESC, nullptr};
    ze_event_desc_t               eventDesc             = {ZE_STRUCTURE_TYPE_EVENT_DESC, nullptr};
    ze_event_pool_handle_t        hEventPool            = nullptr;
    zet_metric_query_pool_handle_t hMetricQueryPool      = nullptr;
    zet_metric_query_handle_t      hMetricQuery          = nullptr;
    zet_metric_query_pool_desc_t   queryPoolDesc         = {ZET_STRUCTURE_TYPE_METRIC_QUERY_POOL_DESC, nullptr};

    // Find a "ComputeBasic" metric group suitable for Event Based collection
    FindMetricGroup( hDevice, "ComputeBasic", ZET_METRIC_GROUP_SAMPLING_TYPE_FLAG_EVENT_BASED, &hMetricGroup );

    // Configure HW
    zetContextActivateMetricGroups( hContext, hDevice, 1 /* count */, &hMetricGroup );

    // Create metric query pool & completion event
    queryPoolDesc.type         = ZET_METRIC_QUERY_POOL_TYPE_PERFORMANCE;
    queryPoolDesc.count        = 1000;
    zetMetricQueryPoolCreate( hContext, hDevice, hMetricGroup, &queryPoolDesc, &hMetricQueryPool );
    eventPoolDesc.flags = 0;
    eventPoolDesc.count = 1000;
    zeEventPoolCreate( hContext, &eventPoolDesc, 1, &hDevice, &hEventPool );

    // Write BEGIN metric query to command list
    zetMetricQueryCreate( hMetricQueryPool, 0 /*slot*/, &hMetricQuery );
    zetCommandListAppendMetricQueryBegin( hCommandList, hMetricQuery );

    // build your command list
    ...

    // Write END metric query to command list, use an event to determine if the data is available
    eventDesc.index  = 0;
    eventDesc.signal = ZE_EVENT_SCOPE_FLAG_HOST;
    eventDesc.wait   = ZE_EVENT_SCOPE_FLAG_HOST;
    zeEventCreate( hEventPool, &eventDesc, &hCompletionEvent);
    zetCommandListAppendMetricQueryEnd( hCommandList, hMetricQuery, hCompletionEvent, 0, nullptr );

    // use zeCommandQueueExecuteCommandLists( , , , ) to submit your workload to the device

    // Wait for data
    zeEventHostSynchronize( hCompletionEvent, 1000 /*timeout*/ );

    // Read raw data
    size_t rawSize = 0;
    zetMetricQueryGetData( hMetricQuery, &rawSize, nullptr );
    uint8_t* rawData = malloc(rawSize);
    zetMetricQueryGetData( hMetricQuery, &rawSize, rawData );

    // Free the resources
    zeEventDestroy( hCompletionEvent );
    zeEventPoolDestroy( hEventPool );
    zetMetricQueryPoolDestroy( hMetricQueryPool );

    // Deconfigure HW
    zetContextActivateMetricGroups( hContext, hDevice, 0, nullptr );

    // Calculate metric data
    CalculateMetricsExample( hMetricGroup, rawSize, rawData );
    free(rawData);
}
Calculation
Both MetricStreamer and MetricQuery collect the data in device specific, raw form that is not suitable for application processing. To calculate metric values use zetMetricGroupCalculateMetricValues.
The following pseudo-code demonstrates a basic sequence for metric calculation and interpretation:
ze_result_t CalculateMetricsExample( zet_metric_group_handle_t hMetricGroup,
                                       size_t rawSize, uint8_t* rawData )
{
    // Calculate metric data
    uint32_t numMetricValues = 0;
    zet_metric_group_calculation_type_t calculationType = ZET_METRIC_GROUP_CALCULATION_TYPE_METRIC_VALUES;
    zetMetricGroupCalculateMetricValues( hMetricGroup, calculationType, rawSize, rawData, &numMetricValues, nullptr );
    zet_typed_value_t* metricValues = malloc( numMetricValues * sizeof(zet_typed_value_t) );
    zetMetricGroupCalculateMetricValues( hMetricGroup, calculationType, rawSize, rawData, &numMetricValues, metricValues );

    // Obtain available metrics for the specific metric group
    uint32_t metricCount = 0;
    zetMetricGet( hMetricGroup, &metricCount, nullptr );

    zet_metric_handle_t* phMetrics = malloc(metricCount * sizeof(zet_metric_handle_t));
    zetMetricGet( hMetricGroup, &metricCount, phMetrics );

    // Print metric results
    uint32_t numReports = numMetricValues / metricCount;
    for( uint32_t report = 0; report < numReports; ++report )
    {
        printf("Report: %dn", report);

        for( uint32_t metric = 0; metric < metricCount; ++metric )
        {
            zet_typed_value_t data = metricValues[report * metricCount + metric];

            zet_metric_properties_t metricProperties {};
            metricProperties.stype = ZET_STRUCTURE_TYPE_METRIC_PROPERTIES;
            zetMetricGetProperties( phMetrics[ metric ], &metricProperties );

            printf("Metric: %sn", metricProperties.name );

            switch( data.type )
            {
            case ZET_VALUE_TYPE_UINT32:
                printf(" Value: %lun", data.value.ui32 );
                break;
            case ZET_VALUE_TYPE_UINT64:
                printf(" Value: %llun", data.value.ui64 );
                break;
            case ZET_VALUE_TYPE_FLOAT32:
                printf(" Value: %fn", data.value.fp32 );
                break;
            case ZET_VALUE_TYPE_FLOAT64:
                printf(" Value: %fn", data.value.fp64 );
                break;
            case ZET_VALUE_TYPE_BOOL8:
                if( data.value.ui32 )
                    printf(" Value: truen" );
                else
                    printf(" Value: falsen" );
                break;
            default:
                break;
            };
        }
    }

    free(metricValues);
    free(phMetrics);
}
Program Instrumentation
Introduction
The program instrumentation APIs provide tools a basic framework for low-level profiling of device kernels, by allowing direct instrumentation of those programs. These capabilities, in combination with those already provided, and in combination with a custom loader layer, are sufficient for more advanced frameworks to be developed.
There are two types of instrumentation available:
Inter-Function Instrumentation - intercepting and redirecting function calls
Intra-Function Instrumentation - injecting new instructions within a function
Inter-Function Instrumentation
The following capabilities allow for a tool to intercept and redirect function calls:
Inter-module function calls - the ability to call functions between different modules; e.g., the application’s module and a tool’s module
Custom loader layer - the ability to intercept and inject API calls
For example, a tool may use a custom loader layer in any of the following ways:
zeModuleCreate - replace a module handle with instrumented module handle for all functions
zeKernelCreate - replace a kernel handle with instrumented kernel handle for all call sites
zeModuleGetFunctionPointer - replace a function pointer with instrumented function pointer for all call sites
zeCommandListAppendLaunchKernel - replace a kernel handle with instrumented kernel handle at call site
Intra-Function Instrumentation
The following capabilities allow for a tool to inject instructions within a kernel:
zetModuleGetDebugInfo - allows a tool to query standard debug info for an application’s module
zetKernelGetProfileInfo - allows a tool to query detailed information on aspects of a kernel
zeModuleGetNativeBinary - allows for a tool to retrieve the native binary of the application’s module, instrument it, then create a new module using the instrumented version
Custom loader layer - same usage as Inter-Function Instrumentation above
Compilation
A module must be compiled with foreknowledge that instrumentation will be performed for the compiler to generate the proper profiling meta-data. Therefore, when the instrumentation layer is enabled, a new build flag is supported: “-zet-profile-flags <value>”, where <value> must be a combination of zet_profile_flags_t, in hexidecimal.
As an example, a tool could use a custom loader layer to inject this build flag on each zeModuleCreate call that the tool wishes to instrument. In another example, a tool could recompile a Module using the build flag and use a custom loader layer to replace the application’s Module handle with it’s own.
Instrumentation
Once the module has been compiled with instrumentation enabled, a tool may use zetModuleGetDebugInfo and zetKernelGetProfileInfo in order to decode the application’s instructions and register usage for each function in the module.
If a tool requires additional functions to be used, it may create other module(s) and use zeModuleGetFunctionPointer to call functions between the application and tool modules. A tool may use zeModuleGetFunctionPointer to retrieve the Host and device address of each function in the module.
There are no APIs provided for the actual instrumentation. Instead this is left up to the tool itself to decode the application module’s native binary and inject native instructions. This model prevents the instrumentation from being manipulated by the compiler.
Execution
If a tool requires changing the address of an application’s function, then it should use a custom loader layer to intercept API calls dealing with function pointers. For example, zeModuleGetFunctionPointer and all flavors of zeCommandListAppendLaunchKernel.
Program Debug
Introduction
The program debug APIs provide tools a basic framework for debugging device code.
The debug APIs only operate on a single device. When debugging a multi-device system, the tool must debug each device independently.
The debug APIs only operate in the context of a single host process. When debugging multiple host processes at the same time, the tool must debug device code submitted by each host process independently.
Device Debug Properties
A tool may query the debug properties of a device by calling zetDeviceGetDebugProperties.
To start a debug session, a tool should first query the debug properties of the device it wants to attach to. Support for attaching debuggers is indicated by the ZET_DEVICE_DEBUG_PROPERTY_FLAG_ATTACH flag in zet_device_debug_properties_t.
zet_device_debug_properties_t props {};
props.stype = ZET_STRUCTURE_TYPE_DEVICE_DEBUG_PROPERTIES;
zetDeviceGetDebugProperties(hDevice, &props);

if (ZET_DEVICE_DEBUG_PROPERTY_FLAG_ATTACH & props.flags == 0)
    return; // debugging not supporting
Attach and Detach
A tool must attach to a device by calling zetDebugAttach. The library will check the following properties:
the device must support attaching debuggers.
the requested host process must exist.
the tool process must be allowed to debug the requested host process.
Note that this does not require the tool to be attached to the host process.
there must be no other tool attached at the same time.
device debug must be enabled on this system.
If permission is granted, a zet_debug_session_handle_t is provided. The debug session handle can be used in other program debug APIs until the tool detaches again.
To end a debug session, a tool calls zetDebugDetach passing the zet_debug_session_handle_t that had been provided on the corresponding zetDebugAttach call.
The following sample code demonstrates attaching and detaching:
zet_debug_session_handle_t hDebug;

zet_debug_config_t config;
memset(&config, 0, sizeof(config));
config.pid = ...;

errcode = zetDebugAttach(hDevice, &config, &hDebug);
if (errcode)
    return errcode;

...

errcode = zetDebugDetach(hDebug);
if (errcode)
    return errcode;
Devices and Sub-Devices
A tool may attach to any device and will implicitly be attached to all sub-devices of that device.
Implementations that use separate code segments per sub-device may further allow attaching to sub-devices individually. Support for this can be determined by calling zetDeviceGetDebugProperties using a sub-device handle and checking for the ZET_DEVICE_DEBUG_PROPERTY_FLAG_ATTACH flag in zet_device_debug_properties_t. In that case, a tool may choose to either attach to the device or to one or more sub-devices.
When attached to a sub-device, writes to the code segment will not be broadcast to other sub-devices, even though they may share the same address space range. This allows breakpoints to be contained within one sub-device.
If a tool is attached to a sub-device, any attempt to attach to an parent device results in ZE_RESULT_ERROR_NOT_AVAILABLE.
Implementations that share code segments across sub-devices will only allow attaching to devices. Any attempt to attach to a sub-device results in ZE_RESULT_ERROR_NOT_AVAILABLE.
Device Thread Identification
Device threads are identified by their slice, sub-slice, EU, and thread numbers, which lie between zero and the respective number reported by ze_device_properties_t minus one.
If a tool is attached to a device, device threads are enumerated for all sub-devices within that device.
The total number of threads on a device can be computed using device properties as shown in this sample code:
ze_device_properties_t properties {};
properties.stype = ZE_STRUCTURE_TYPE_DEVICE_PROPERTIES;
uint64_t num_threads;

zeDeviceGetProperties(hDevice, &properties);

num_threads = properties.numSlices * properties.numSubslicesPerSlice *
    properties.numEUsPerSubslice * properties.numThreadsPerEU;
Tools may enumerate all possible thread identifiers based on device properties by iterating over the number of slices, sub-slices, EUs, and threads.
Thread Availability
Not all threads may be available at all times and some threads may not be available at any time. This may have various reasons, including:
the thread may be idle
the thread may be assigned to a different process
For the purpose of this debug tool API, threads may be in one of three states:
running
stopped
unavailable
Debug Events
As soon as the debug session has been started, it will receive debug events from the device. To read the topmost event in the FIFO, the tool must call zetDebugReadEvent.
The following sample code demonstrates reading an event:
zet_debug_event_t event;
errcode = zetDebugReadEvent(hDebug, UINT64_MAX, &event);
if (errcode)
    return errcode;

...

if (event.flags & ZET_DEBUG_EVENT_FLAG_NEED_ACK) {
    errcode = zetDebugAcknowledgeEvent(hDebug, &event);
    if (errcode)
        return errcode;
}
A debug event is described by the zet_debug_event_t structure, which contains:
The event type as zet_debug_event_type_t.
A bit-vector of zet_debug_event_flags_t, which can be:
ZET_DEBUG_EVENT_FLAG_NEED_ACK indicates that the event needs to be acknowledged by calling zetDebugAcknowledgeEvent. This allows tools to perform any action in response to an event and indicate their completion by acknowledging the event.
Implementations are allowed to block reading of new events until the previous event has been acknowledged. If an implementation allows reading further events, it must allow acknowledging events out of order.
Following the common fields, the event object contains event-specific fields depending on the event type. Not all events have event-specific fields.
ZET_DEBUG_EVENT_TYPE_DETACHED: the tool was detached.
The detach reason as zet_debug_detach_reason_t. This can be:
ZET_DEBUG_DETACH_REASON_HOST_EXIT indicates that the host process exited.
ZET_DEBUG_EVENT_TYPE_PROCESS_ENTRY: the host process created one or more command queues on the device.
ZET_DEBUG_EVENT_TYPE_PROCESS_EXIT: the host process destroyed all command queues on the device.
ZET_DEBUG_EVENT_TYPE_MODULE_LOAD: an in-memory module was loaded onto the device.
ZET_DEBUG_EVENT_TYPE_MODULE_UNLOAD: an in-memory module is about to get unloaded from the device.
ZET_DEBUG_EVENT_TYPE_THREAD_STOPPED: threads stopped due to a device exception.
The reported threads remain stopped until they are resumed by a call to zetDebugResume.
ZET_DEBUG_EVENT_TYPE_THREAD_UNAVAILABLE: threads cannot be interrupted because they are unavailable.
The event is generated in response to an interrupt request if none of the requested threads is available to be interrupted.
ZET_DEBUG_EVENT_TYPE_PAGE_FAULT: there was a page fault on the device
The event provides the page fault reason, the faulting address aligned to the page granularity, and a mask specifying the alignment.
To mask can be bit-wise ANDed with an address to obtain an address that is similarly aligned to the same page granularity as the provided faulting address.
Run Control
The tool may interrupt and resume device threads by calling zetDebugInterrupt and zetDebugResume, respectively.
The thread argument may specify a single thread, a group of threads, or all threads on the device. To specify all threads, the tool must set all fields in ze_device_thread_t to their maximum value. By setting some but not all fields to their maximum value, a tool may specify a group of threads.
The zetDebugInterrupt call is not blocking. When all specified threads either stopped or are determined to be currently unavailable, the tool receives a ZET_DEBUG_EVENT_TYPE_THREAD_STOPPED event if at least one thread could be stopped or a ZET_DEBUG_EVENT_TYPE_THREAD_UNAVAILABLE event if none of the threads is currently available.
If the thread argument specified a group of threads or all threads on the device, the event may be preceded by ZET_DEBUG_EVENT_TYPE_THREAD_STOPPED events of individual threads.
The tool does not know whether a thread stopped or is unavailable until it tries to access its state or access memory through it. Unavailable threads may become available at any time.
The following sample code demonstrates how to interrupt and resume all threads in a debug session:
ze_device_thread_t allthreads;
allthreads.slice = UINT32_MAX;
allthreads.subslice = UINT32_MAX;
allthreads.eu = UINT32_MAX;
allthreads.thread = UINT32_MAX;

errcode = zetDebugInterrupt(hDebug, allthreads);
if (errcode)
    return errcode;

...

errcode = zetDebugResume(hDebug, allthreads);
if (errcode)
    return errcode;
Memory Access
A tool may read and write memory in the context of a stopped device thread as if that thread had read or written the memory.
Memory may be partitioned into device-specific memory spaces. For example, GPU devices support the following memory spaces, defined by zet_debug_memory_space_type_t:
ZET_DEBUG_MEMORY_SPACE_TYPE_DEFAULT - default memory space
ZET_DEBUG_MEMORY_SPACE_TYPE_SLM - shared local memory space
The default memory space may also be accessed in the context of the special thread with all fields set to their maximum value.
To read and write memory, call the zetDebugReadMemory and zetDebugWriteMemory function, respectively. The functions specify the thread(s), memory space and input or output buffer, respectively.
The following example copies 16 bytes of memory from one location in the context of one device thread to another location in the default memory space:
zet_debug_memory_space_desc_t srcSpace = {
    ZET_STRUCTURE_TYPE_DEBUG_MEMORY_SPACE_DESC,
    nullptr,
    ZET_DEBUG_MEMORY_SPACE_TYPE_DEFAULT,
    srcAddress
};
zet_debug_memory_space_desc_t dstSpace = {
    ZET_STRUCTURE_TYPE_DEBUG_MEMORY_SPACE_DESC,
    nullptr,
    ZET_DEBUG_MEMORY_SPACE_TYPE_DEFAULT,
    dstAddress
};

ze_device_thread_t thread0 = {
    0, 0, 0, 0
};

uint8_t buffer[16];
errcode = zetDebugReadMemory(hDebug, thread0, &srcSpace, sizeof(buffer), buffer);
if (errcode)
    return errcode;

...

errcode = zetDebugWriteMemory(hDebug, allthreads, &dstSpace, sizeof(buffer), buffer);
if (errcode)
    return errcode;
Register State Access
A tool may read and write the register state of a stopped device thread.
Registers are grouped into sets of similar registers. The types of register sets supported by a device can be queried using zetDebugGetRegisterSetProperties and zetDebugGetThreadRegisterSetProperties. The former provides general information about the register sets supported on a device. The latter provides the concrete register set for the argument thread. The register set may depend on dynamic properties and may change between stops. The register set properties specify details about each register set, such as the maximum number of registers in each set, and whether the register set is read-only.
The actual type of registers is device-specific and will be defined by the device vendor.
The following pseudo-code demonstrates obtaining register set properties for a device:
uint32_t nRegSets = 0;
zetDebugGetRegisterSetProperties(hDevice, &nRegSets, nullptr);

zet_debug_regset_properties_t* pRegSets = allocate(nRegSets * sizeof(zet_debug_regset_properties_t));
zetDebugGetRegisterSetProperties(hDevice, &nRegSets, pRegSets);
The following pseudo-code demonstrates obtaining register set properties for a thread:
ze_device_thread_t thread0 = {
    0, 0, 0, 0
};
uint32_t nRegSets = 0;
zetDebugGetThreadRegisterSetProperties(hDebug, thread0, &nRegSets, nullptr);

zet_debug_regset_properties_t* pRegSets = allocate(nRegSets * sizeof(zet_debug_regset_properties_t));
zetDebugGetThreadRegisterSetProperties(hDebug, thread0, &nRegSets, pRegSets);
To read and write the register state, use the zetDebugReadRegisters and zetDebugWriteRegisters function, respectively.
The following pseudo-code demonstrates iterating over register sets:
for (i = 0; i < nRegSets; ++i) {
    void* values = allocate(pRegSets[i].count * pRegSets[i].valueSize);

    errcode = zetDebugReadRegisters(hDebug, thread0, pRegSets[i].type, 0, pRegSets[i].count, values);
    if (errcode)
        return errcode;

    ...

    errcode = zetDebugWriteRegisters(hDebug, thread0, pRegSets[i].type, 0, pRegSets[i].count, values);
    if (errcode)
        return errcode;

    free(values);
}